
Uncover dynamics of changing land characteristics with spatiotemporal analysis
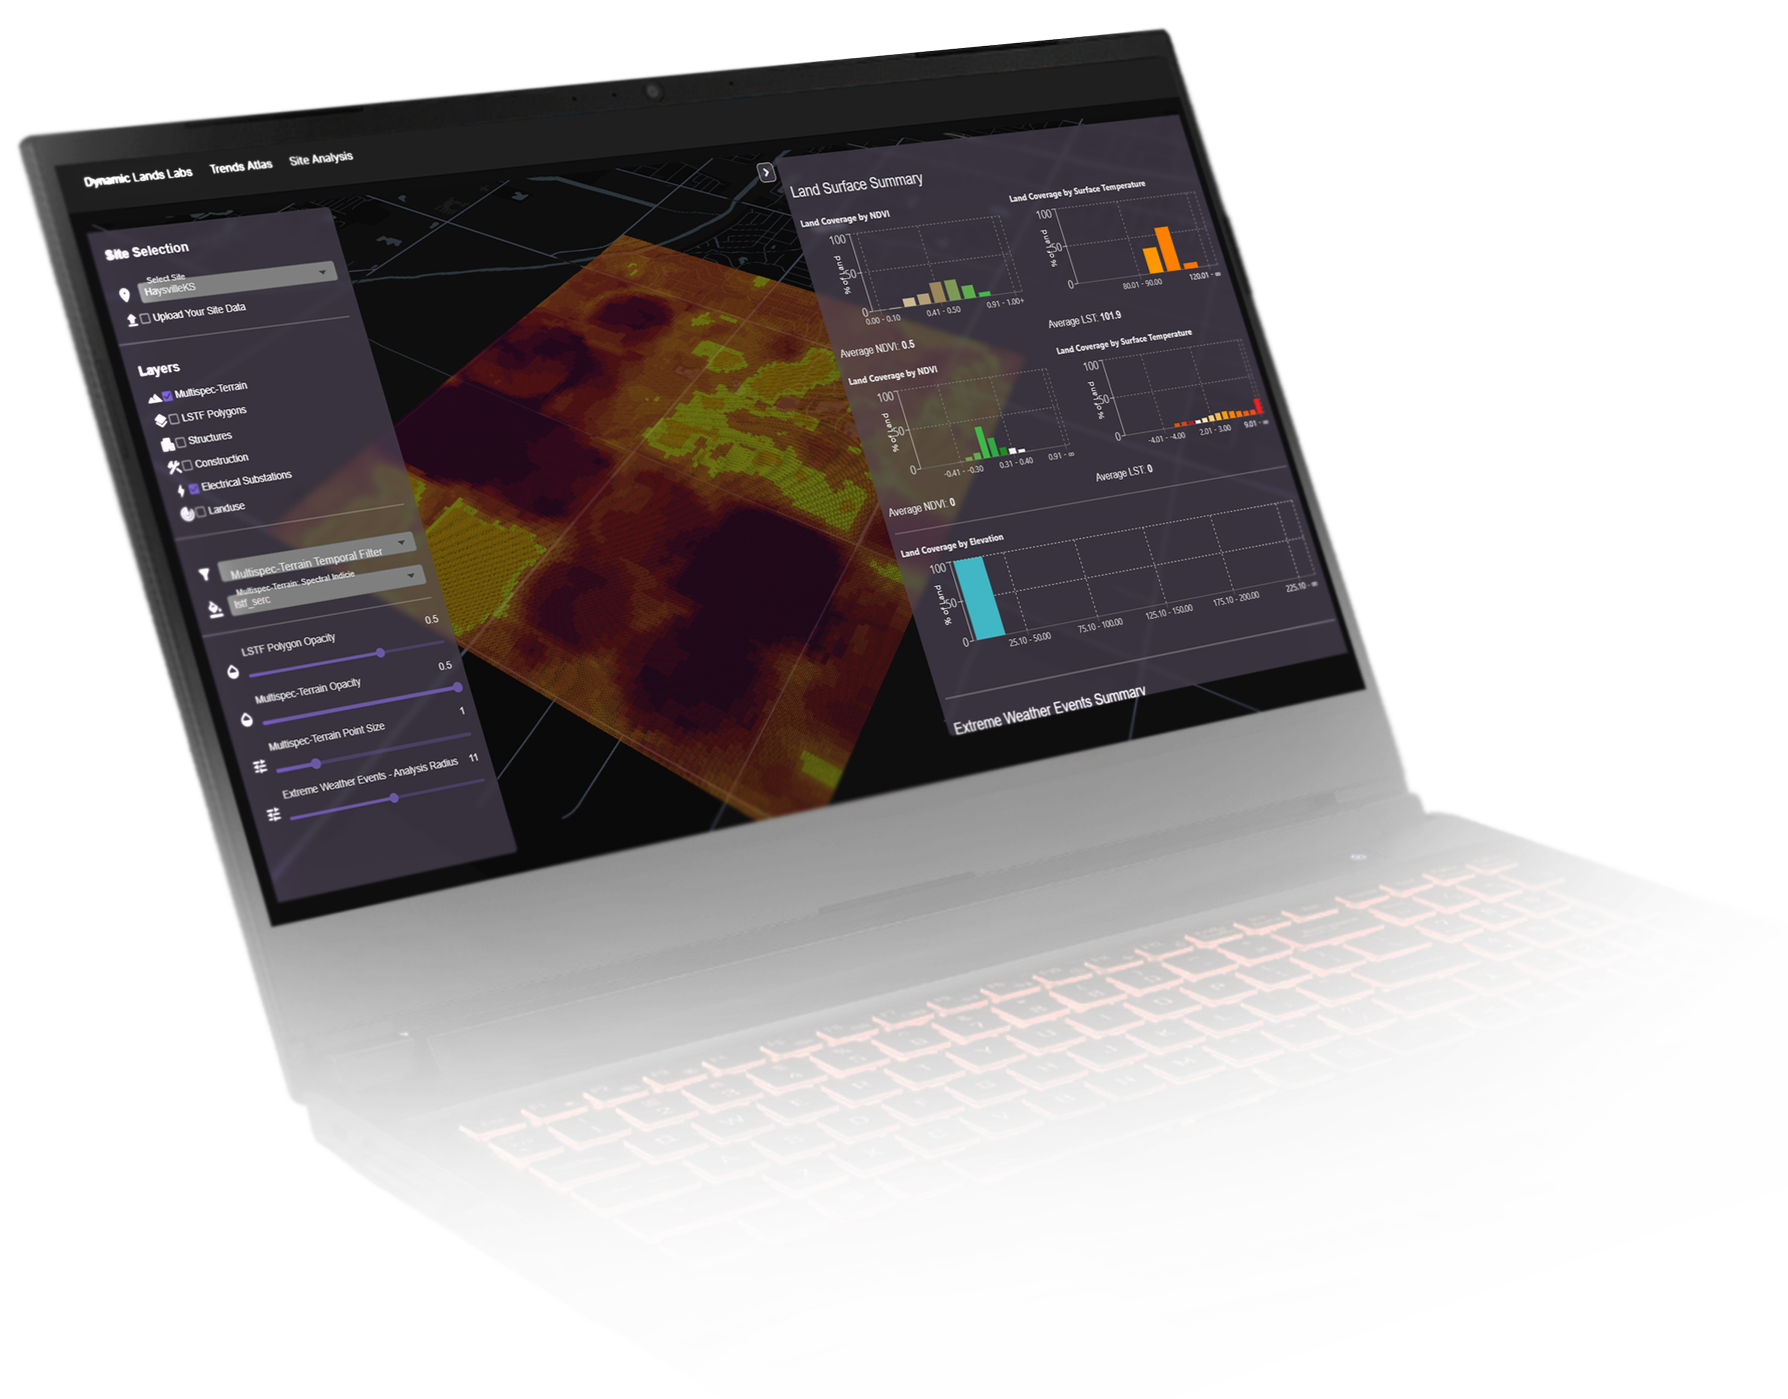
Dynamic Lands Lab integrates multispectral satellite imagery, LiDAR, aerial imagery and GIS data to reveal environmental, contextual and temporal dynamics to inform site selection and early-stage design decisions.
Dynamic Lands Lab is a geospatial research project focused on producing preprocessed spatial intelligence for understanding land dynamics. By combining multispectral imagery, terrain analysis, and spatial context, it delivers structured data products and interactive tools that support informed exploration of site conditions, environmental patterns, and landscape behavior.
What is Dynamic Lands Lab?
Dynamic Lands Lab produces preprocessed geospatial intelligence designed to help users understand land dynamics with clarity. By integrating multispectral imagery, elevation models, and spatial vector datasets, the project supports analysis of vegetation health, surface temperature, and proximity to critical built-environment features. These capabilities are complemented by advanced terrain analytics, including slope and aspect characterization, terrain roughness indices, and directional change signals that capture local relief, flow tendencies, and watershed-scale behaviors such as pooling, drainage pathways, and erosion potential.
Together, these curated outputs provide timely, spatially coherent context for evaluating agricultural suitability, site conditions, environmental constraints, and broader socioeconomic patterns. Dynamic Lands Lab emphasizes the delivery of structured, reusable data products alongside intuitive web-based exploration tools, 3D design-environment integrations, and high-resolution drone-derived imagery, enabling users to engage with complex spatial dynamics through multiple analytical and design workflows.
Measure annual and seasonal patterns across multiple land surface characteristics
Comprehensive data from trusted sources
-
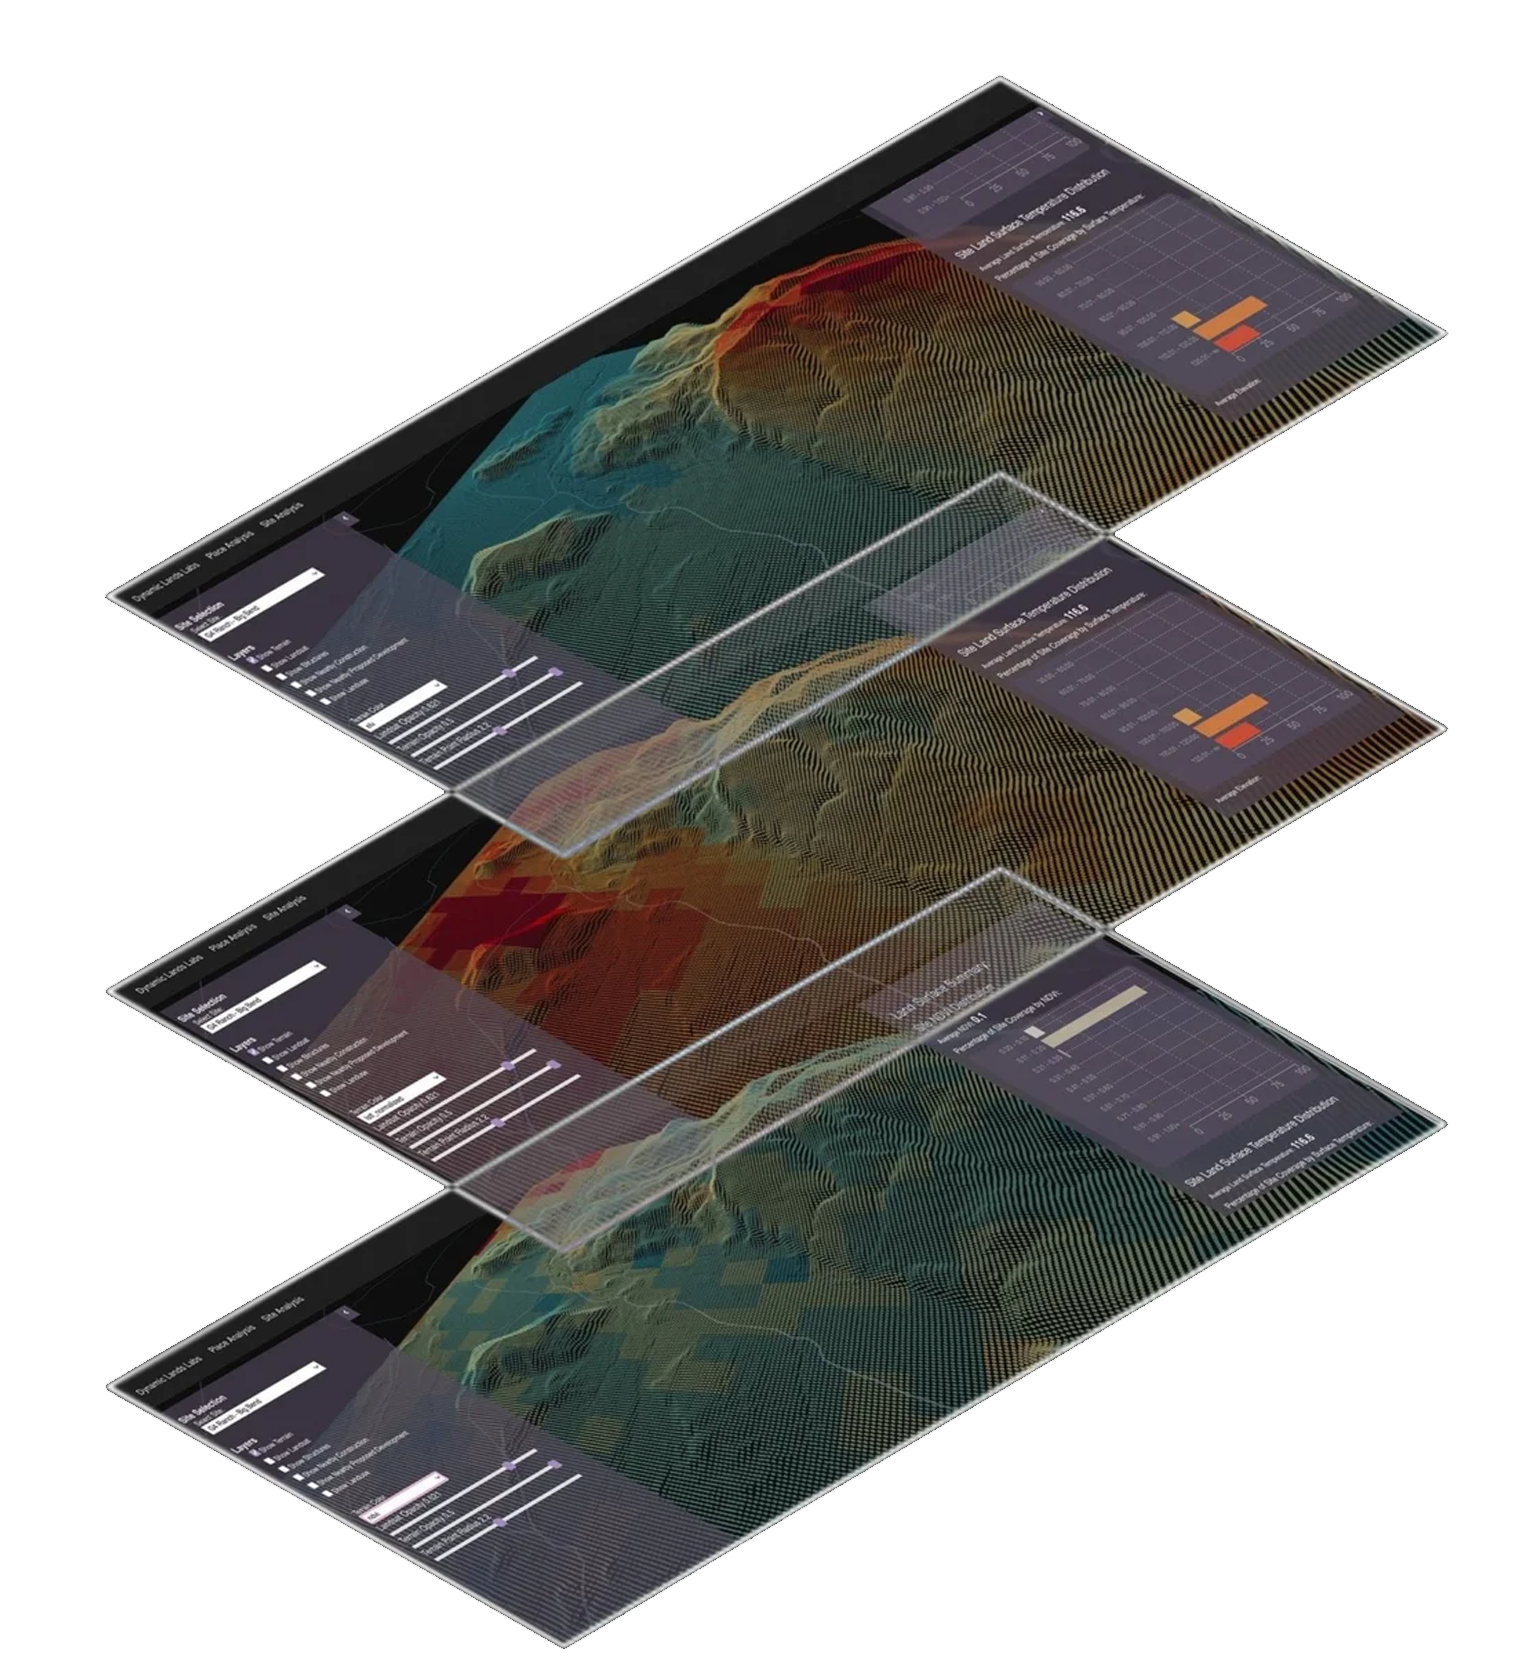
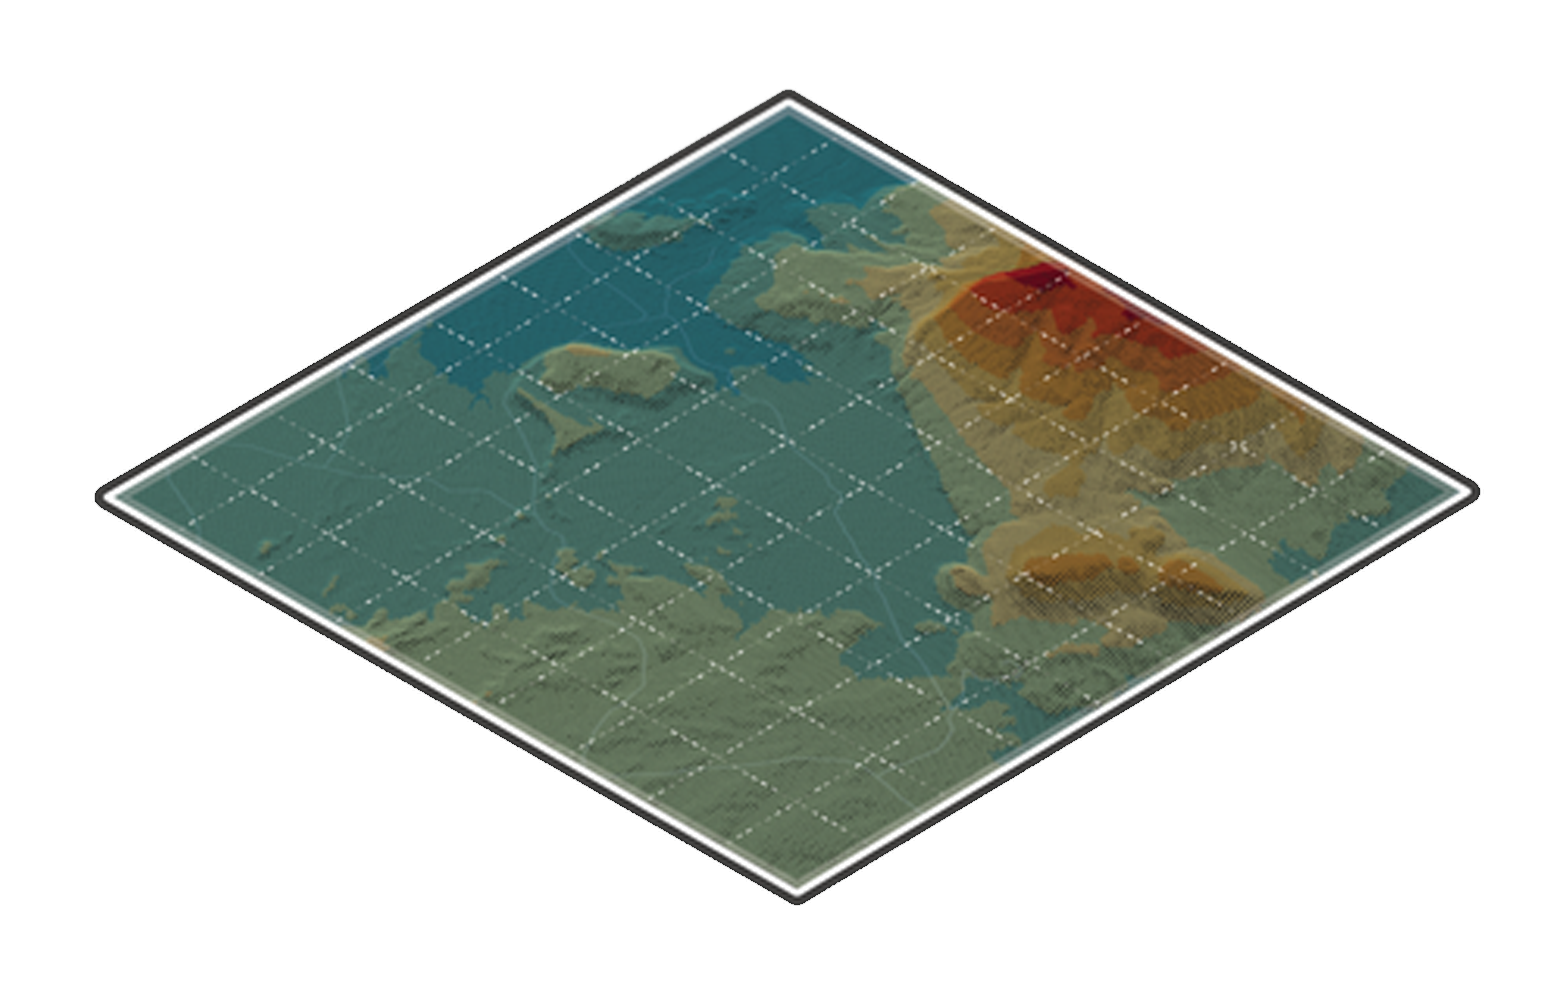
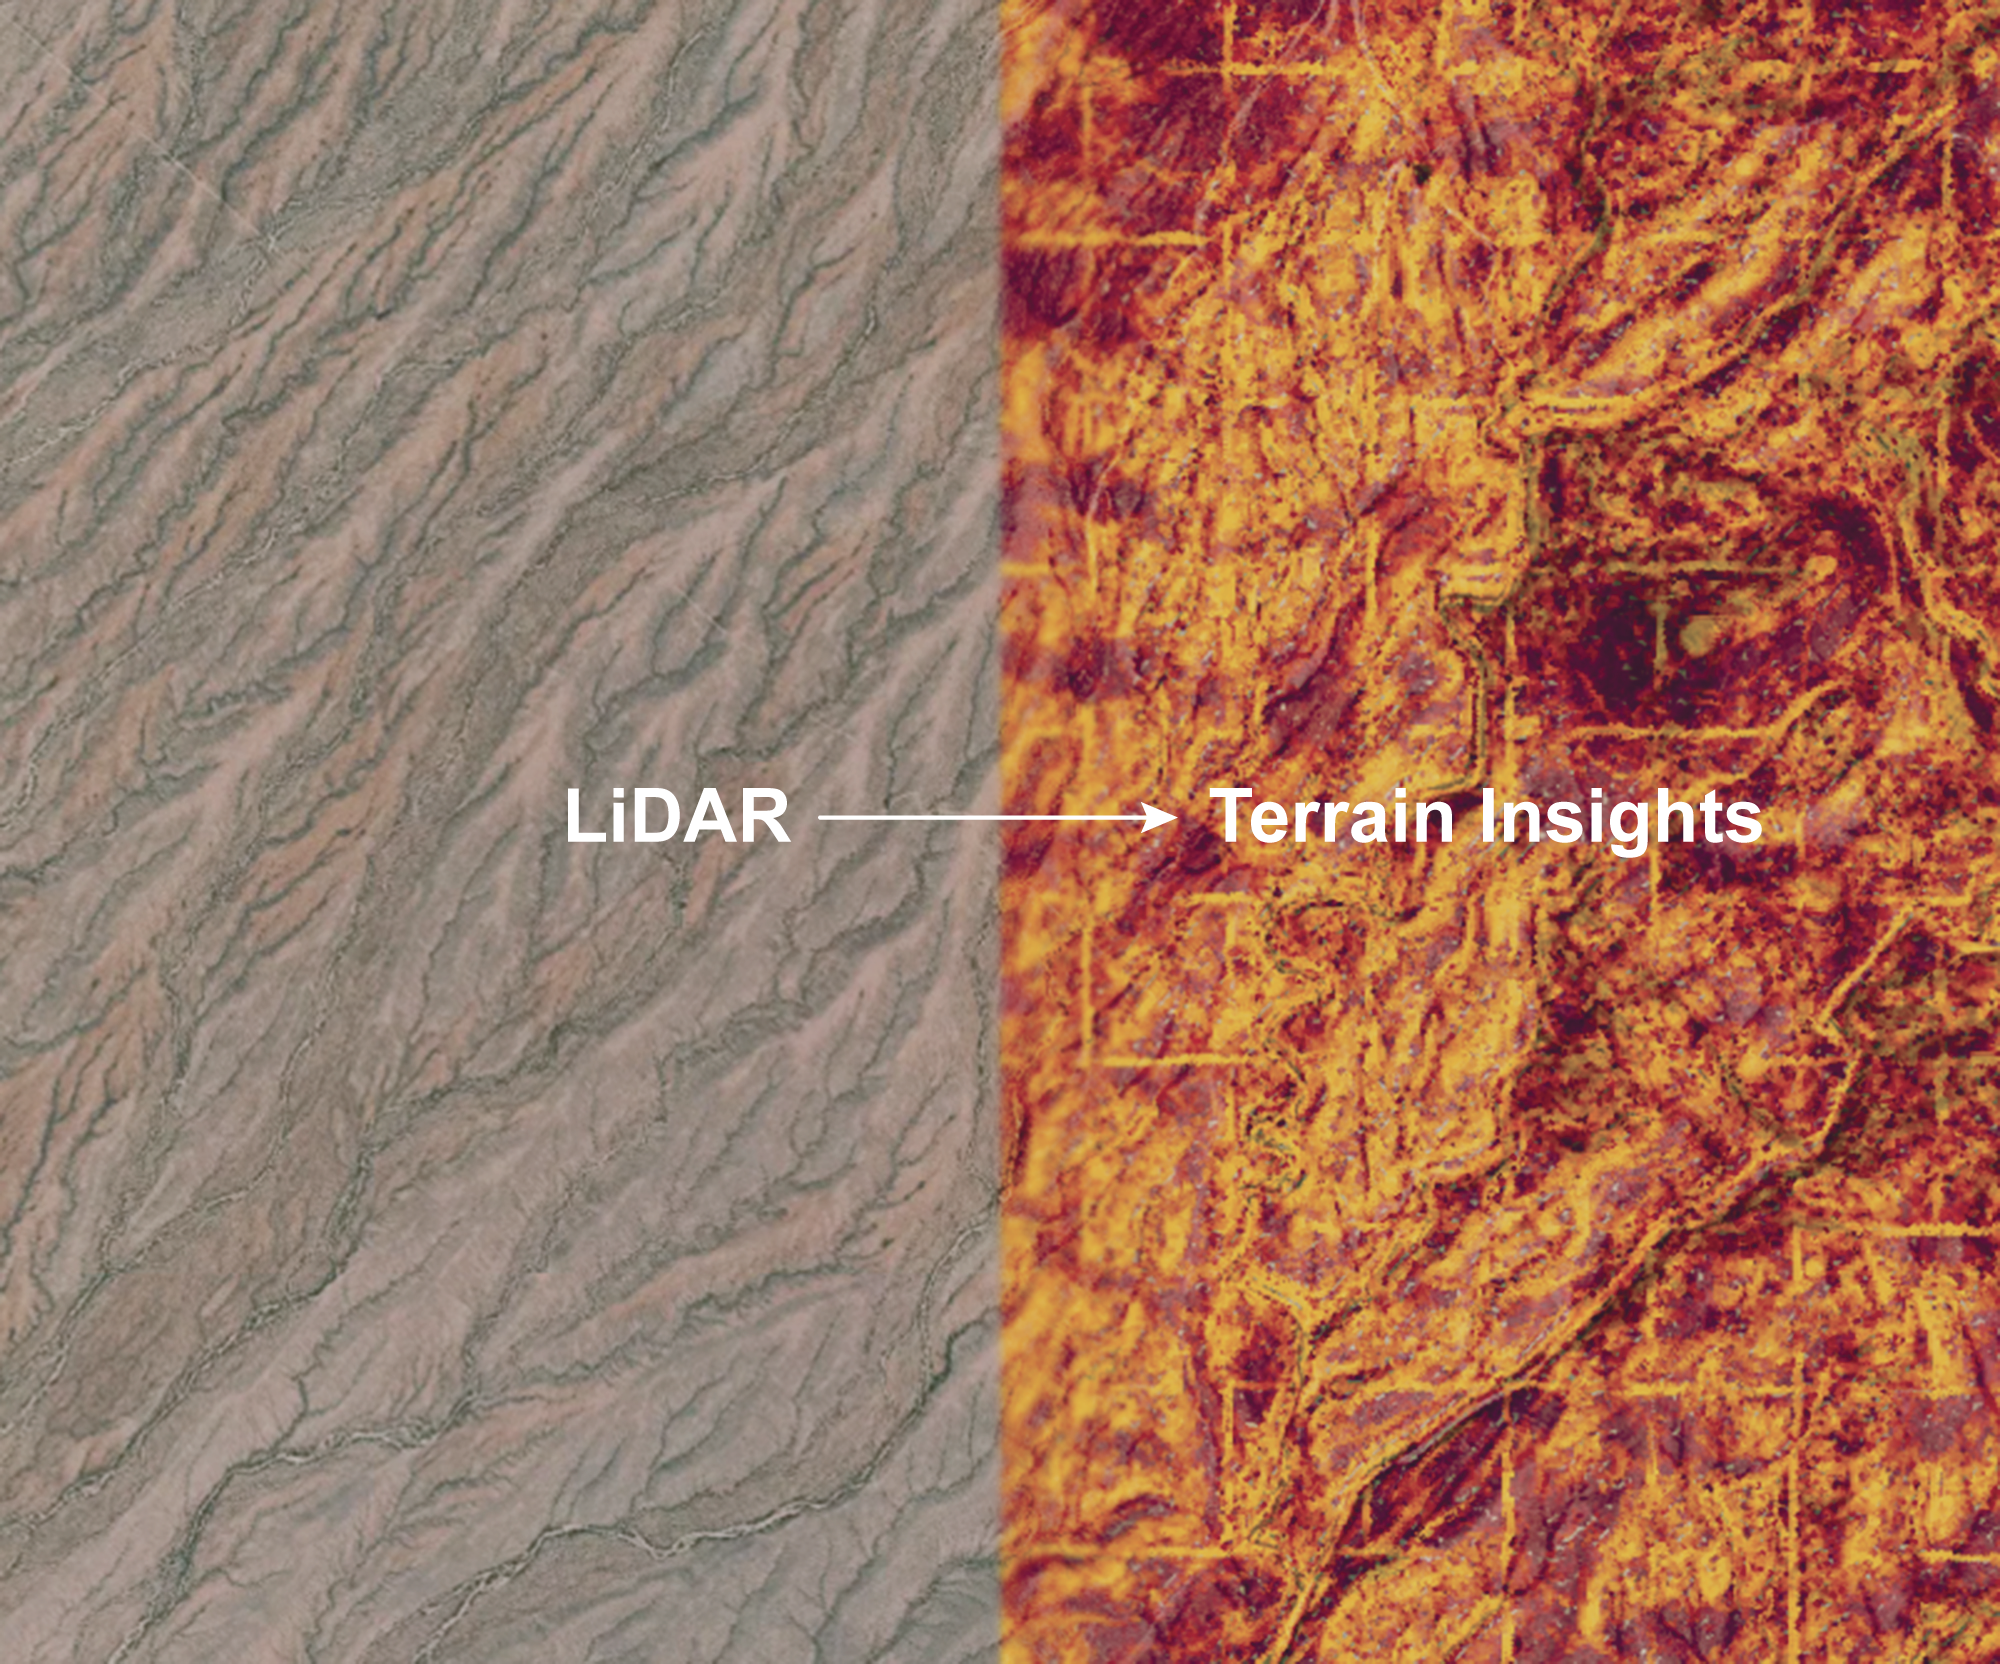
Understand the elevation and slope characteristics of land in combination with land surface temperature and NDVI. The Terrain module uses aerial LiDAR data from the USGS’s 3DEP program to generate 3D terrain and land surface characteristics point clouds.
-
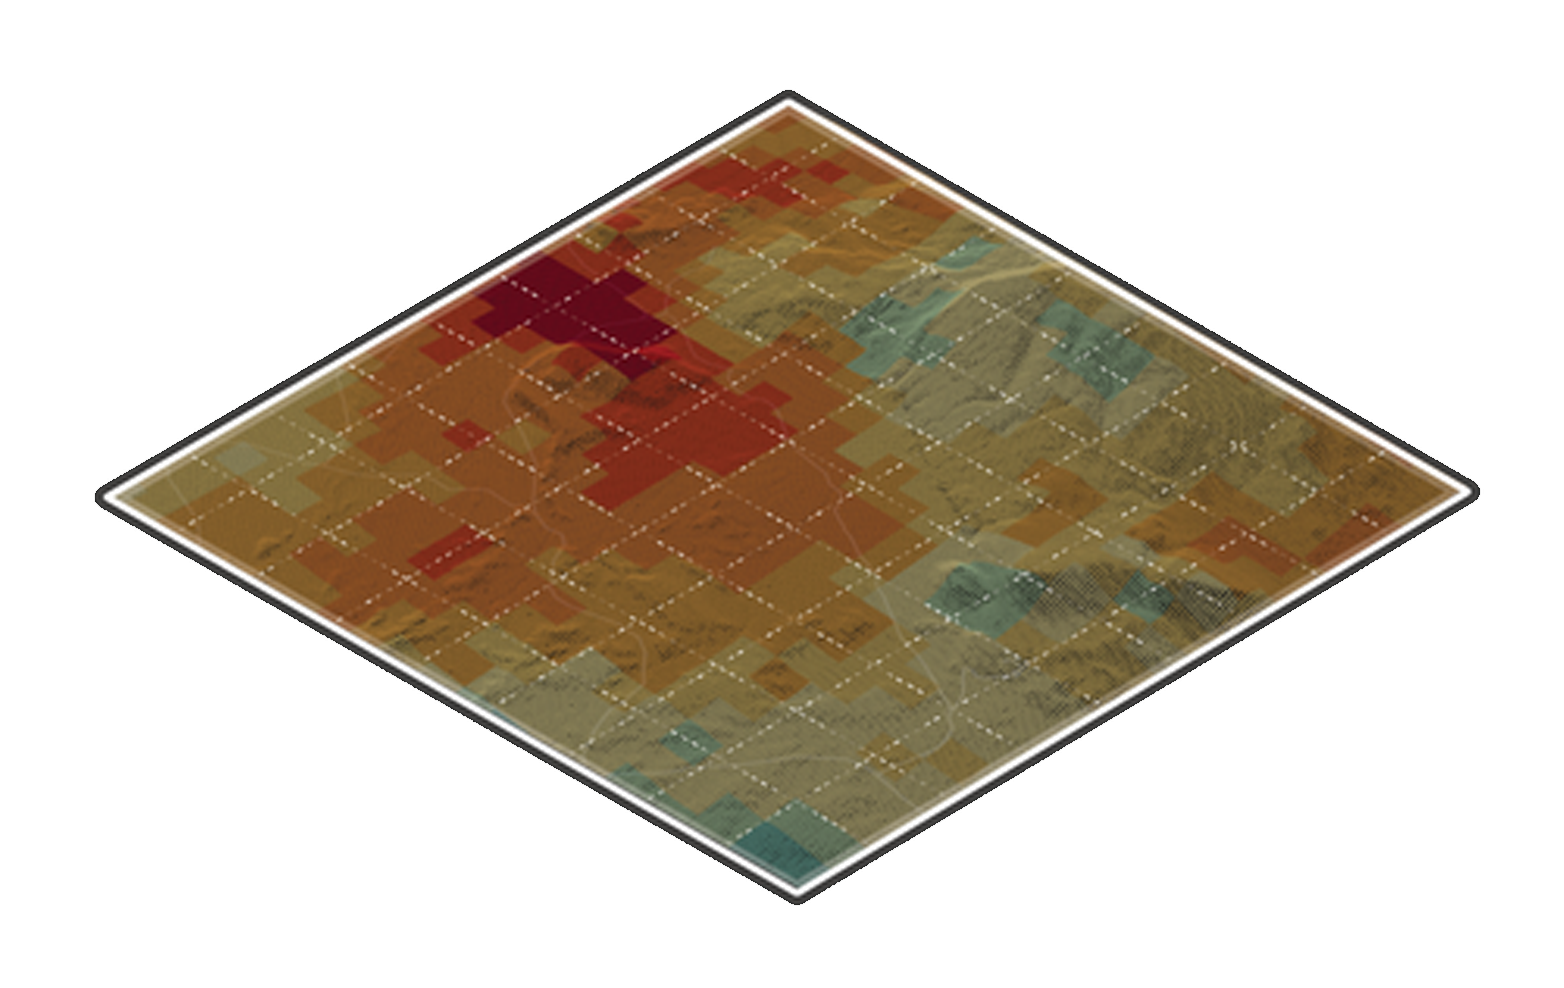
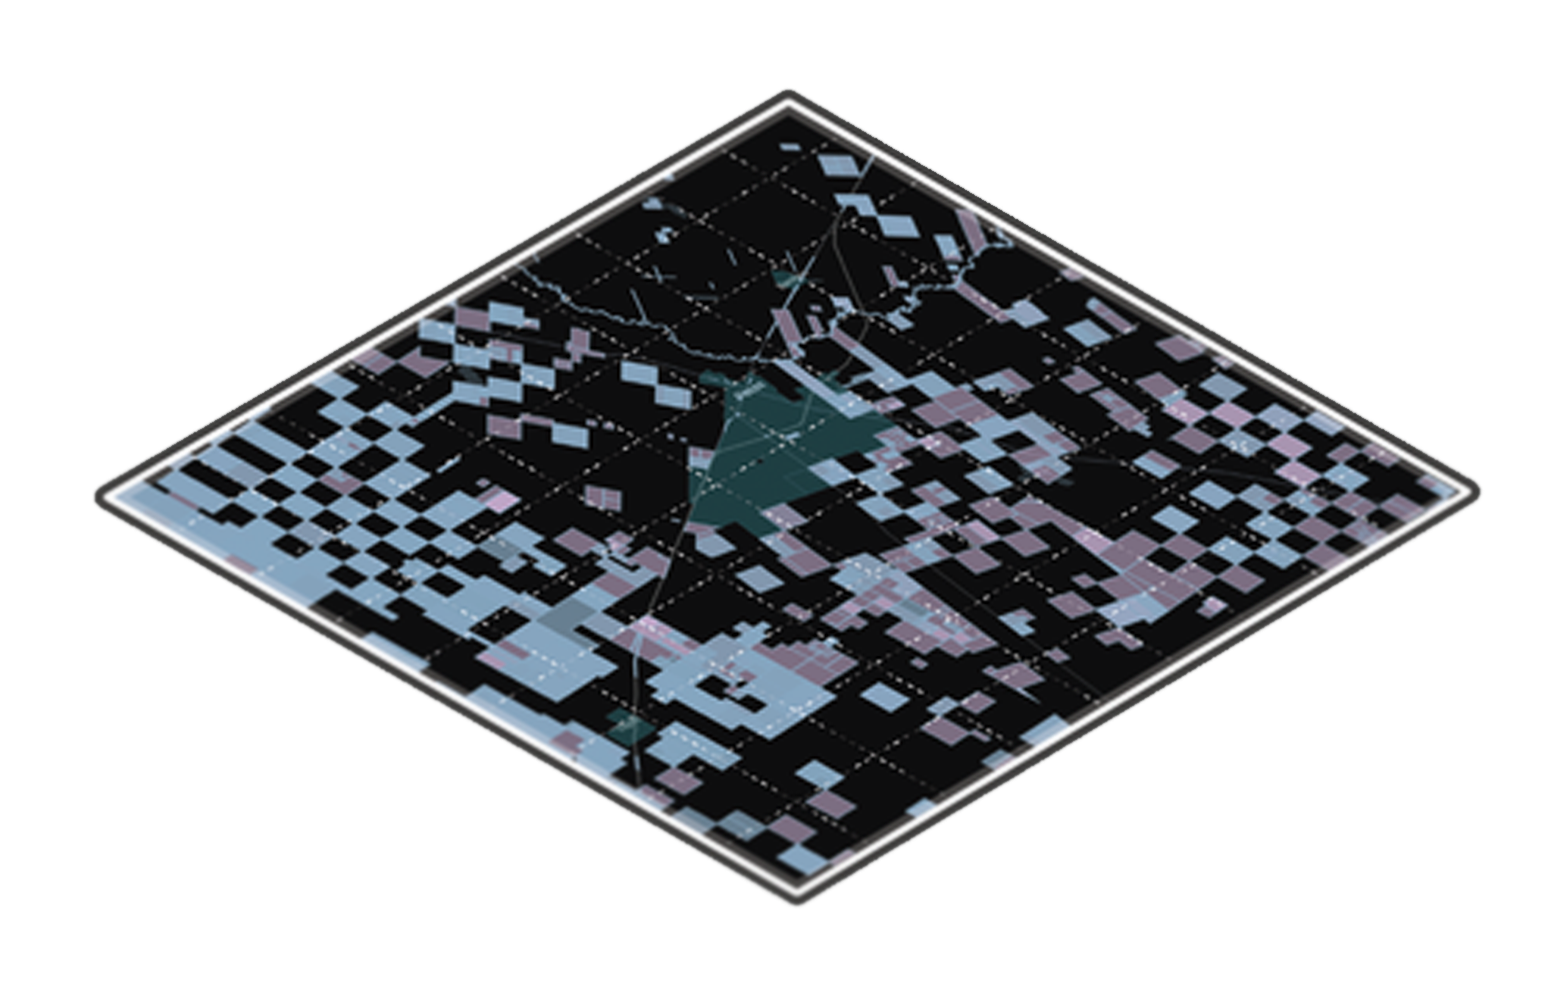
Identify what parts of your site may experience excessive heat and understand the spatial distribution of heat across your site. The LST module uses multispectral raster data from Landsat to calculate year over year changes in land surface temperature at 30 meter spatial resolution.
-
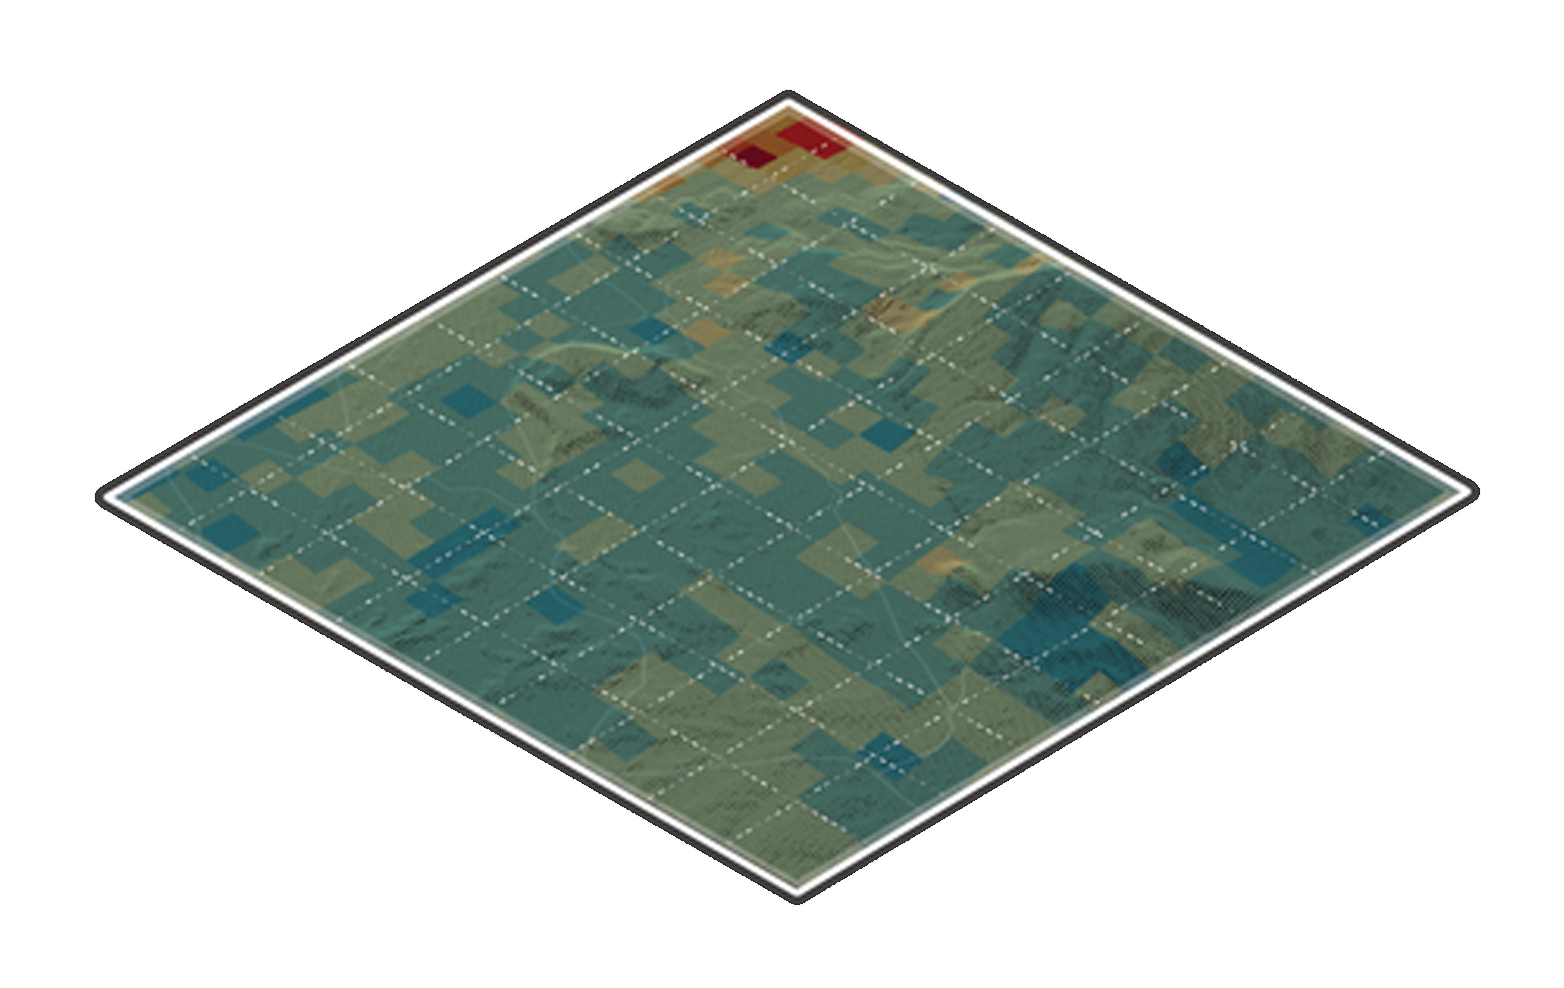
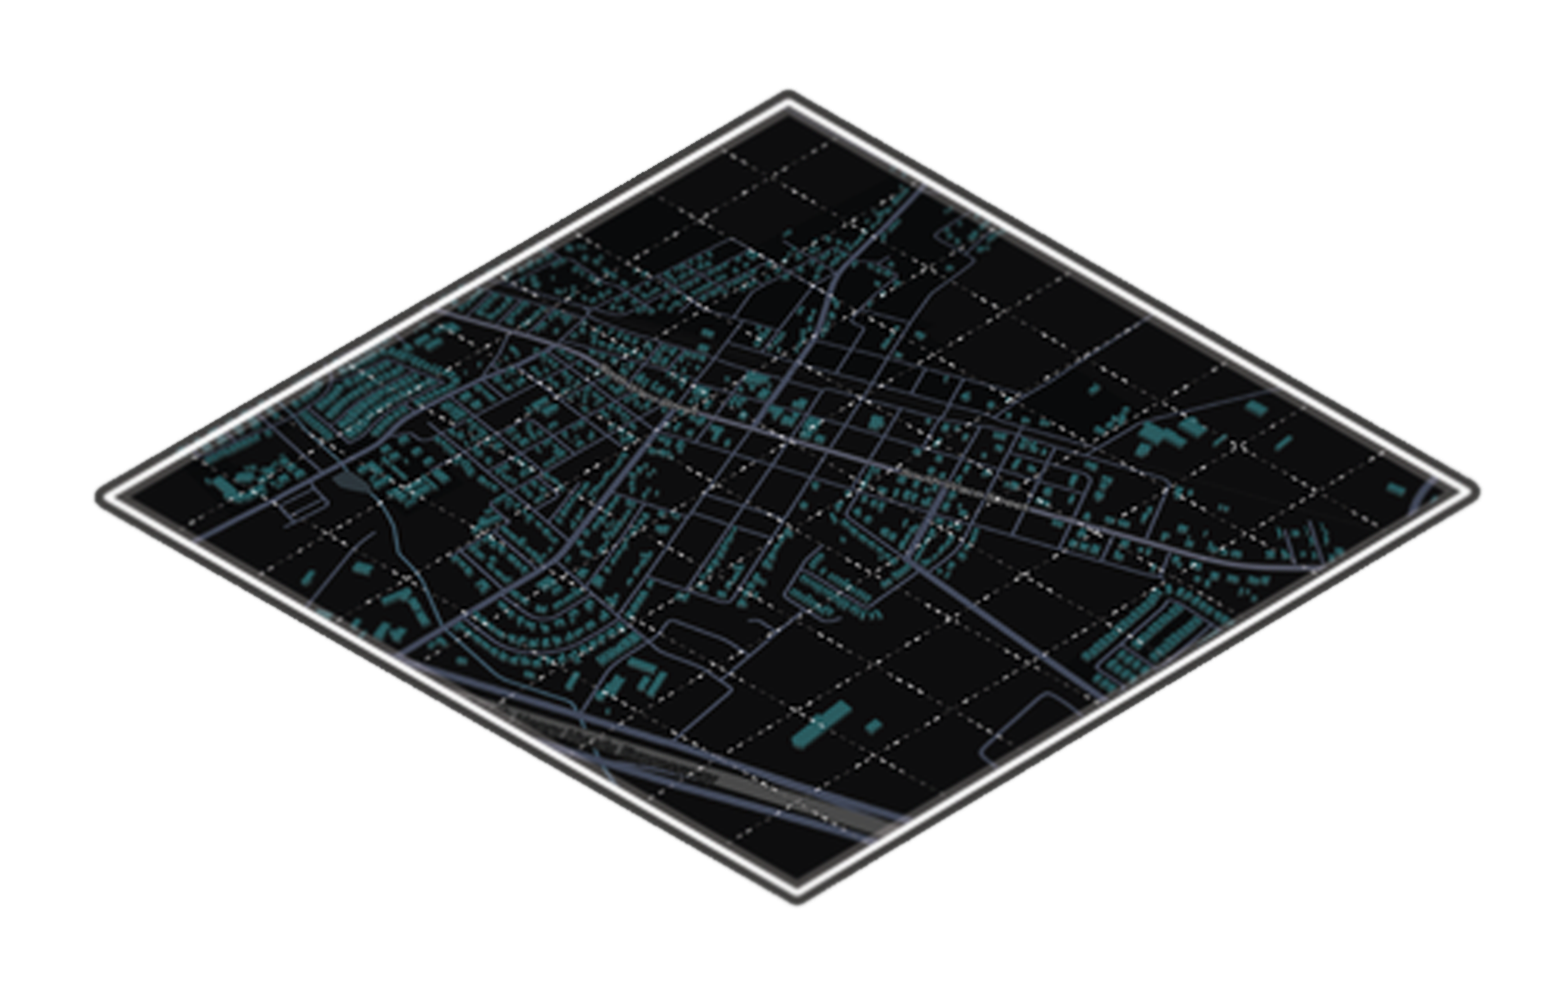
Identify where vegetation is thriving, where it is struggling and assess the viability of site for vegetation growth. NDVI or Normalized Difference Vegetation Index is a key spectral signature for measuring vegetation health and density. The NDVI module uses multispectral raster data from Landsat to calculate year over year changes in NDVI at 10 meter spatial resolution.
-
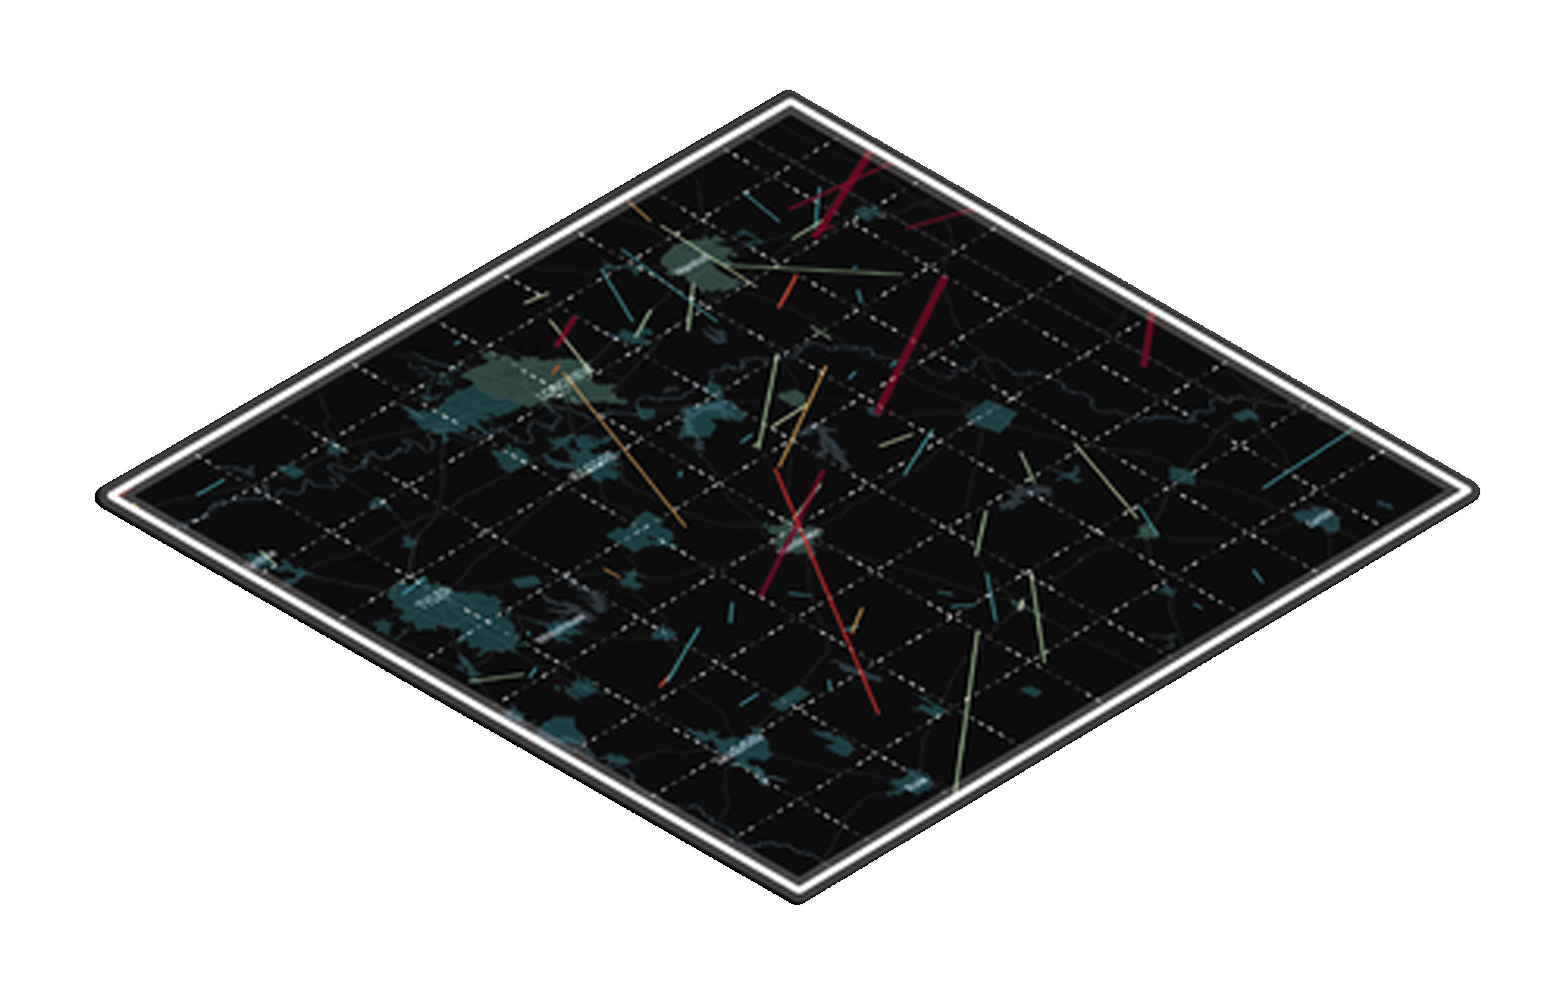
Be aware of potential future weather events by understanding the past. The Tornado module uses historical tornado path data to determine if your site has experienced direct or near-by encounters with tornados.


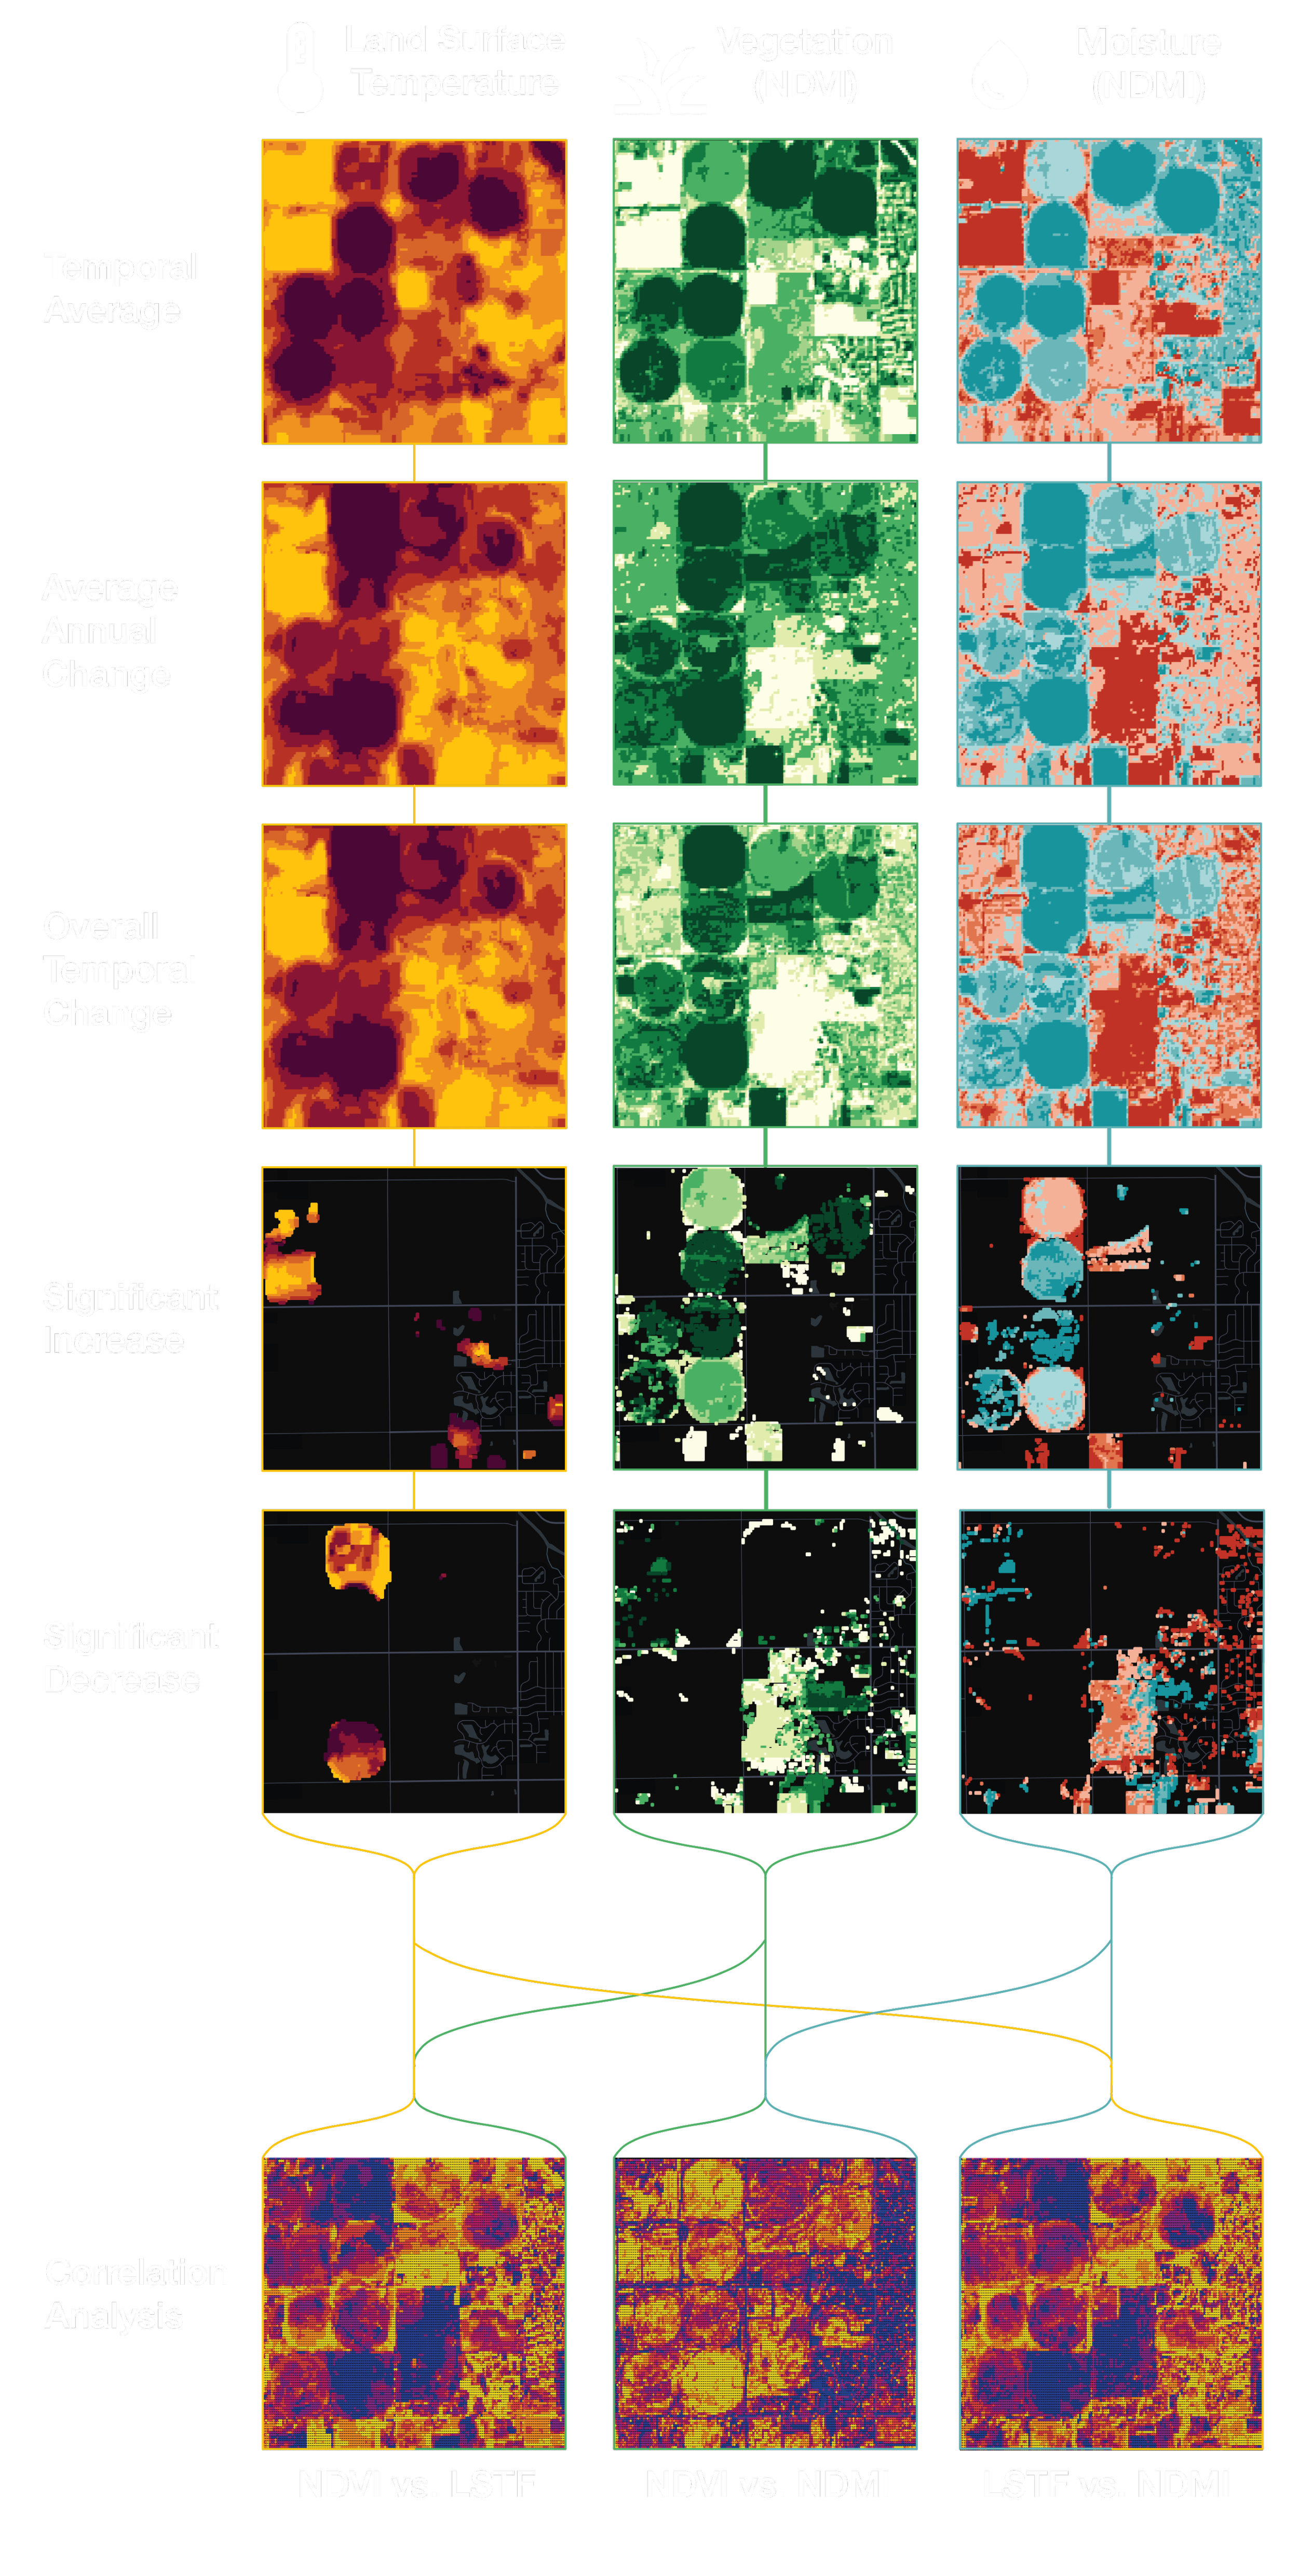
Identify spatiotemporal patterns with multispectral analysis
Spatiotemporal analysis of surface temperature, NDVI, and NDMI reveals how land conditions evolve over time, highlighting the impacts of management practices, climate pressures, and environmental change. By measuring long-term trends, annual shifts, and areas of significant increase or decline, you can pinpoint where vegetation is stressed, soil moisture is changing, or heat is intensifying insights that support smarter decisions for improving crop performance, reducing heat impacts, and guiding more effective land stewardship.
Directional Terrain Signals
Terrain signal analysis goes beyond basic slope and elevation modeling by explaining how landforms are structured and oriented. By analyzing directional slope signals, surface roughness, and terrain organization, these processes reveal how water and sediment move across the landscape.
Terrain signal processing metrics include:
Anisotropy (terrain organization)
TRI (Terrain Roughness Index)
Downhill Fraction
Dominant Slope Direction & Magnitude
Slope & Aspect
Calculate distance from known structures and surface materials
Knowing the distance to nearby structures and surface materials is crucial for understanding how runoff, heat, and other environmental factors may impact your land. Proximity to features like asphalt, buildings, or roadways helps identify potential risks such as chemical runoff, soil contamination, or localized heat effects so you can make informed decisions about site planning, agriculture, and land management.